Many frontend developers build applications that “work”: pages load, buttons click, and API calls return data. But something is often wrong: the web pages are slow, performance metrics are poor, or overly complex patterns are used to mask the underlying problem.
The reason isn’t always bad code or poor tools; it’s a gap in core fundamentals. Over time, I’ve observed that a deep understanding of how JavaScript actually executes is what separates code that just “works” from truly optimized, performant applications
The Core Issue: Understanding How JavaScript Actually Works
Most developers can use JavaScript effectively, but relatively few understand what makes it tick: the event loop, call stack, heap, closures, scope, Web APIs, and promises.
The event loop is the beating heart of JavaScript’s concurrency model, handling synchronous and asynchronous code execution. Yet in my experience interviewing developers, most cannot explain how it works.
Understanding the call stack and heap is equally critical:
- The Stack is used for static memory allocation like primitive types and function calls. It’s simple, last-in first-out (LIFO), and extremely fast to access.
- The heap is used for dynamic memory allocation, where objects and arrays live.
Once you grasp this, many React performance issues become clear. For instance, passing an object or function directly into a useEffect dependency array creates a new reference on every render. That’s why React keeps re-running effects unnecessarily. It’s not “React’s fault,” it’s how JavaScript memory and references work under the hood.
Using Performance Metrics to Identify Real Problems
Performance optimization should be data-driven, not guesswork. Tools like Lighthouse and Core Web Vitals provide measurable metrics that reveal exactly where applications struggle:
- FCP (First Contentful Paint)– when the first piece of DOM content is visible
- LCP (Largest Contentful Paint)– when the main content finishes loading
- CLS (Cumulative Layout Shift)– how much the page layout unexpectedly shifts during loading
- TBT (Total Blocking Time)– how long the main thread is blocked from responding to user input
- RTT (Round Trip Time)– network latency affecting load speed
These insights identify what truly slows down a site. Is it JavaScript blocking the main thread? Unoptimized images? Heavy third-party scripts? Are layout shifts causing poor user experience? Without measuring, you’re just guessing.
There are excellent free resources and documentation available from browser vendors and web standards organizations that provide detailed guides on interpreting these metrics and implementing optimization techniques. The key is to understand the underlying principles, not just follow tutorials.
From Theory to Results: Real-World Impact
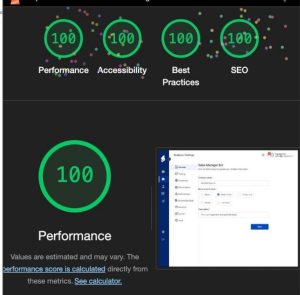
Applying these fundamentals produces measurable results. I’ve optimized websites from 30% performance scores to 96%, and built web applications that achieve 100% across all Lighthouse categories: Performance, Accessibility, Best Practices, and SEO.
These improvements aren’t just about scores. A performance optimization that improved load times and eliminated layout shifts reduced bounce rate by 23% and increased conversions. Performance isn’t just technical; it’s revenue.
As a team lead, this knowledge became the foundation for effective code reviews. Instead of simply noting whether code “works,” I can explain why it works or doesn’t, spot anti-patterns before they reach production, and guide developers toward writing cleaner, more efficient code.
What Too Many Developers Still Miss
Many engineers, even senior ones, skip the fundamentals. They know frameworks, hooks, and libraries, but don’t truly understand what happens behind the scenes.
With AI tools generating code for us, it’s even easier to fall into this trap. You paste a snippet that works, but do you really know how or why? Sometimes what should take two lines of clean, efficient code turns into six lines of AI-generated complexity that creates unnecessary re-renders or memory overhead.
If you can’t explain what the code does and why it performs the way it does, you don’t really own it.
The Path Forward
Don’t just make it work. Make it make sense.
For those struggling with performance issues: go back to the fundamentals. Understand how JavaScript runs, how memory is managed, and how the browser renders your application. Learn the “why” behind event loops, promises, closures, and React render cycles.
Study the official documentation for JavaScript, browser APIs, and the frameworks you use. Understand the performance metrics and what they measure. Use browser DevTools to see where your code actually spends time.
When you understand that foundation, performance tuning stops being guesswork and your code stops being “functional” and starts being exceptional.
The difference between developers who struggle with performance and those who build fast, efficient applications isn’t talent or experience alone. It’s whether they’ve invested time in understanding the fundamentals that underpin everything they build.
That understanding is what enables you to look at any codebase and pinpoint exactly what’s blocking the main thread, causing layout shifts, or creating memory leaks. It’s what transforms you from someone who can make things work to someone who can make things work exceptionally well.


